 Erlangen image generation for chemical compounds
Note: I have not taken pains to make this page compatible with all browsers and versions of HTML. This page was previewed using Netscape 2.0.2. No other version of this page is available.
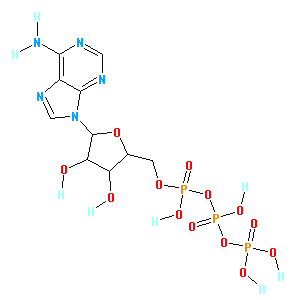
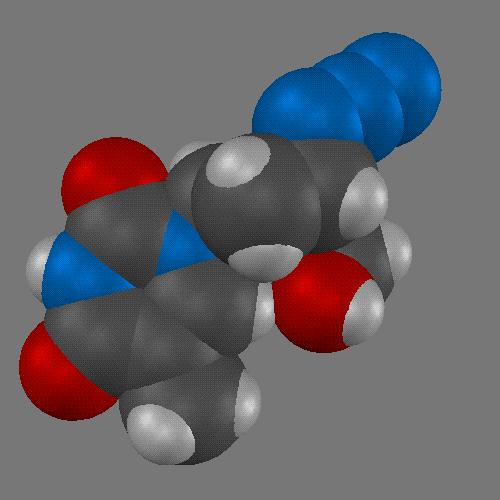
If we can't judge a book by its cover, why should we be concerned about the surface of a molecule? Aren't the properties of a molecule completely determined by the atoms from which it is made? We can represent a molecule simply by its empirical formula. While this tells us exactly how many atoms of each type make up the molecule, this is rarely what we encounter when a chemist wants to tell us which molecule she is dealing with. A structural diagram like the one below is essentially what a chemist "means" when describing a molecule. These diagrams show clearly the atoms which make up the molecule as well as how they are bonded to each other.
Erlangen image generation for chemical compounds
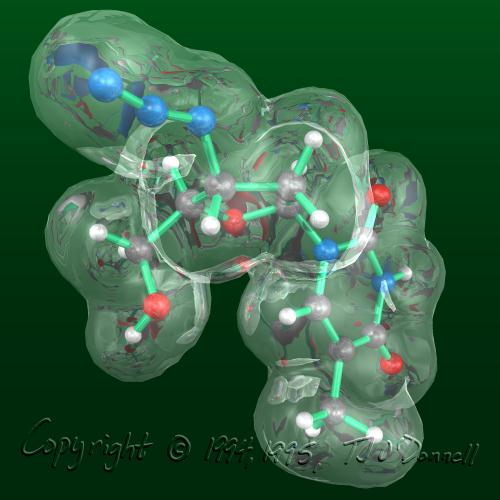
A three dimensional line drawing of a molecule can be readily made using computer graphics, either from experimental atomic coordinates or from a calculated molecular geometry. Three dimensional representations of molecules are not limited to line drawings or wire models. A spherical representation of the atoms in a molecule along with the valence geometry at a particular atom results in a CPK type, or space-filling three dimensional model of molecular structure. In fact, the CPK type model is perhaps the simplest type of representation of molecular surface.
In such a model, one's attention is not drawn to the nature of the bonding (single, double, aromatic, etc.), but instead to the surface of the atoms, to the surface of the molecule. Some atoms are even hidden by CPK models. In larger molecules, the distinction between atoms near the molecular surface and hidden atoms becomes more important. There are many other ways to represent molecular surface. The sections below introduce several useful methods for computing and displaying molecular surfaces.
The earliest definition of molecular surface was published by Lee and Richards[Lee, 1971]. They described a method whereby surface atoms could be distinguished from buried atoms and the total surface of the molecule could be described as a sum of atomic surfaces. The realization of this theoretical work as a computable (and displayable) molecular surface was published by Greer and Bush [Greer, 1978]. Connolly then proposed a better algorithm in which a hypothetical probe sphere rolled over the atoms of the molecule[Connolly, 1983]. The record of where this probe touched the molecule's atoms resulted in the molecular surface.
These algorithms for computing molecular surfaces were oriented toward the display of surfaces. For practical reasons (computers could only display lines, dots and text quickly in those days), molecular surfaces were rendered as a field of dots. Connolly has continued his work and implemented other rendering methods[Connolly, 1983a]. An extensive review article by Connolly appears in this issue of Network Science.
Some more recent methods focus on improving speed over Connolly's algorithm [Klein, 1990] [Voorinhalt, 1989] [Sanner, 1995].
 Images
courtesy of
Michel F. Sanner.
Images
courtesy of
Michel F. Sanner.
Other methods focused on improving the mathematical or analytical representation of the surface[ Connolly, Duncan]. Duncan's approach to the representation of analytical molecular surface is based on a spherical harmonic functional description of a pre-computed surface. It results in an analytical representation that can be simple or quite complex, depending on the need.
 Images courtesy of
Bruce Duncan
Images courtesy of
Bruce Duncan

(left) An order 10 spherical harmonic approximation of SOD colored by shapeindex. Red corresponds to convex points, blue to concave points, and white to saddle points. (right) An order 50 spherical harmonic approximation of SOD.
 Image
courtesy of
Mike Connolly
Connolly's
analytical surface represents the molecular surface as union of
spherical sections and toroidal sections. The molecular surface
of crambin is shown above, with the convex spherical patches colored
yellow, the saddle-shaped pieces of tori colored green, and the
concave reentrant surface colored blue.
Image
courtesy of
Mike Connolly
Connolly's
analytical surface represents the molecular surface as union of
spherical sections and toroidal sections. The molecular surface
of crambin is shown above, with the convex spherical patches colored
yellow, the saddle-shaped pieces of tori colored green, and the
concave reentrant surface colored blue.
An analytical description of molecular surface can be used in algorithms which attempt to explain and predict intermolecular surface interactions and molecular docking. An analytical surface description is also advantageous for quick and smooth-looking display of molecular surface using modern computer graphics display algorithms and hardware.
Molecular surfaces are an important tool for representing molecules
and for computing inter-molecular interactions. There is however,
more to a molecule than its surface. Various molecular properties,
such as atomic charge, electrostatic potential, hydrophobicity,
polarizability, etc. strongly influence the way in which molecules
interact with one another. In order to represent this added dimension
of molecular properties, one can encode information onto a molecular
surface computed in one of the ways described above. This extra
information has been displayed using color codes and texture maps.
For example, in the surface below color-coded by electrostatic
potential, the red areas (where the surface is negative) are interpreted
as areas which will most favorably interact with another molecular
surface which is blue (where the surface is positive).
 Image
courtesy of
GRASP and Anthony Nicholls.
Image
courtesy of
GRASP and Anthony Nicholls.
These kinds of representations are used to understand and predict how molecules will interact with one another, dock with one another and even to design molecules which will optimally bind to another molecule, as in drug-receptor interactions.
In the preceding examples, the added dimensional of molecular property was shown varying on a fixed molecular surface. Another way to represent a molecular property is to leave the value of the property fixed and compute and display the surface "where" that property is. This can be accomplished using an iso-valued contour surface in three dimensions. If one uses van der Waals' energy of interaction of a molecule with a test probe as the molecular property, a three dimensional contour surface at a constant value of just above zero results in a surface equivalent to a CPK molecular surface. A similar sort of surface is produced by contouring electron density properties of a molecule, either from experimental x-ray crystallography or quantum mechanical computations.
If one uses other properties, say electrostatic potential and produces iso-valued three dimensional contour surfaces, much more unusual looking surfaces result. The surfaces of neuraminidase shown below were computed using Coulomb's law with partial atomic charges and displayed as a color-coded surface (left) and an iso-valued electrostatic potential energy surface (right).
Both were computed using the same charges and are displayed in the same orientation. The color-coded surface on the left clearly highlights regions on the solvent-accessible molecular surface which are expected to strongly interact with either positive or negative regions on a complementary molecular surface. The iso-valued electrostatic potential surface on the right shows negative and positive areas which do not correspond to those in the left figure. Which one is correct? The color-coded solvent-accessible surface shows very close range interactions which can occur once two molecules have successfully docked. The iso-valued electrostatic potential surface extends out much further in space and is an indication of how a docking molecule might be guided toward neuraminidase through longer-range electrostatic interactions.
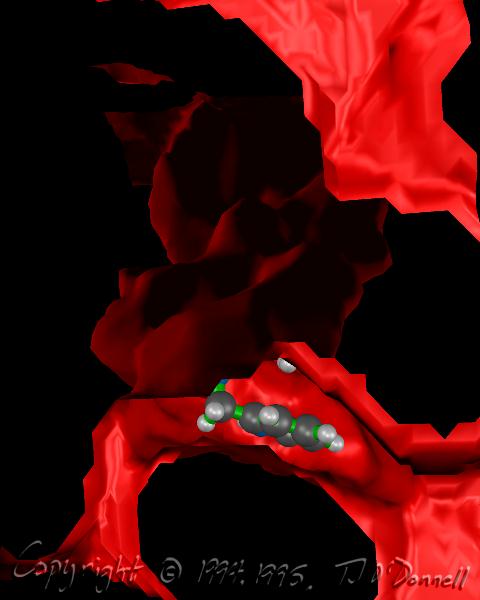
Iso-valued contour surfaces are computed as three dimensional contours of (measured or computed) data stored in a grid space surrounding a molecule. For example, electron density data from xray crystallography experiments is a type of processed experimental data stored in "bricks" of space around the molecule. Difference density maps are sometimes used to highlight changes in electron density due to changes in experimental conditions, e.g. protein side-chain mutation. In the figure below, a grid of van der Waals' energies was computed for a protein plus an inhibitor. Another grid of energies was computed for the protein alone. Finally, a grid of the difference between these two grids was computed and contoured. The resulting surface is interpreted as the binding pocket of the protein.
While this binding pocket is the one ideally suited for the known inhibitor in this case, it is useful as a guide for designing new inhibitors.
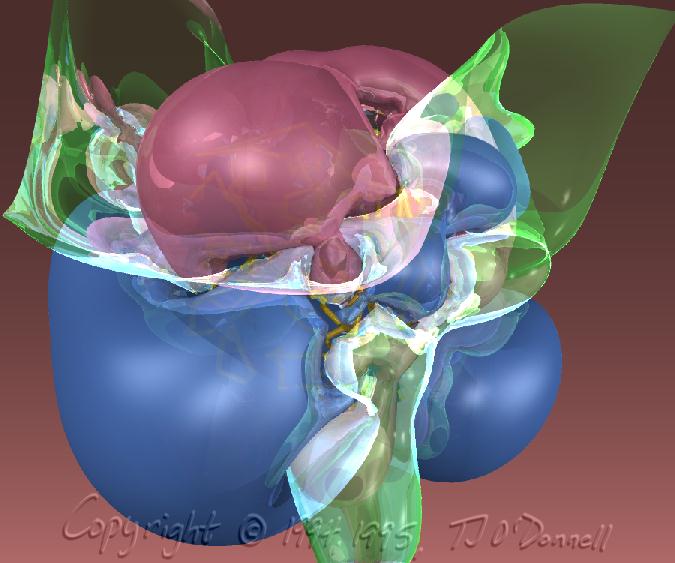
In my experiments with different techniques for surface computation, iso-valued contour surface generation, difference surfaces, etc., I often find myself fascinated with the surfaces themselves as objects of beauty independent of their scientific meaning or usefulness. For example, in the AZT Total Electron Density surface shown below, the use of crystal glass properties to display the transparent surface caused remarkable effects, such as the concave magnifying mirror-like portions of the surface. In the HIV Protease in Black and Red, a difference surface is used to form a sort of cave, curiously inviting, inhabited by an inhibitor, yet menacing and burning red. In Neuraminidase Electrostatic Potential, the wing-like nature of the green (zero contour level) softens and divides the contrasting lobes above and below. In AZT LUMO, the natural forms that arise from the complex, abstract, mathematical quantum mechanical description of the molecule can be appreciated.
 <<< HIV Protease in Black and Red
 <<< AZT Total Electron Density
 <<< Neuraminidase Electrostatic Potential
 <<< AZT LUMO
In July of 1994, David Goodsell and I organized the first Molecular Graphics Art Show in conjunction with the 13th annual Molecular Graphics Society meeting. Many interesting examples of art arising from molecular structure can be seen there. Other interesting sites with beautiful molecular-inspired work are:
Computer Visualizations of Viruses
Pharmaceutical Information Network Gallery
The Representation of Molecular Models Rendering Techniques
B. Lee, F. M. Richards, The Interpretation of Protein Structures: Estimation of Static Accessibility, Journal of Molecular Biology, 1971, 55, 379-400.
J. Greer, B. Bush, Macromolecular Shape and Surface Maps by Solvent Exclusion, Proceedings of the National Academy of Sciences USA 1978, 75, 303-307.
M. L. Connolly, Analytical Molecular Surface Calculation, Journal of Applied Crystallography, 1983, 16, 548-558; Solvent-accessible Surfaces of Proteins and Nucleic Acids, Science, 1983, 221, 709-713.
J. Gasteiger, X. Li, A. Uschold, The Beauty of Molecular Surfaces as Revealed by Self-organizing Neural Networks, Journal of Molecular Graphics, 1994, 12, 90-97.
M. Teschner, C. Henn, H. Vollhardt, S. Reiling, J. Brickmann, Texture Mapping: A New Tool for Molecular Graphics, Journal of Molecular Graphics, 1994, 12, 98-105.
TJ O'Donnell, Interactive Computation and Display of Molecular Surfaces, Journal of Molecular Graphics, 1992, 10, 39-40.
B. Duncan, A. J. Olson, Texture Mapping Parametric Molecular Surfaces, Journal of Molecular Graphics, 1995, 13, 258-264.
T. Klein, C. Huang, E. Pettersen, G. Couch, T. Ferrin, and R. Langridge, A Real-Time Malleable Molecular Surface, Journal of Molecular Graphics, 8, 1990, 16-24 and 26-27.
Voorinhalt, M. T. Kosters, G. Vegter, G. Friend, W.G.J. Hol, A Very Fast Program for Visualizing Protein Surfaces, Channels and Cavities, Journal of Molecular Graphics, 1989, 7, 243.
M. F. Sanner, A. J. Olson, J. Spehner, Fast and Robust Computation
of Molecular Surfaces, Proceedings 11th ACM Symposium on
Computational Geometry, C6-C7, 1995.
 larger image
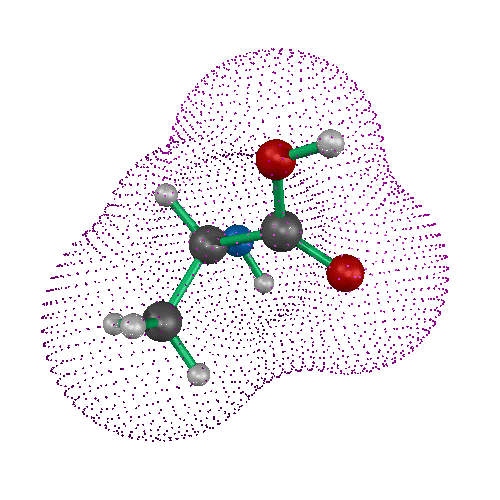 larger image
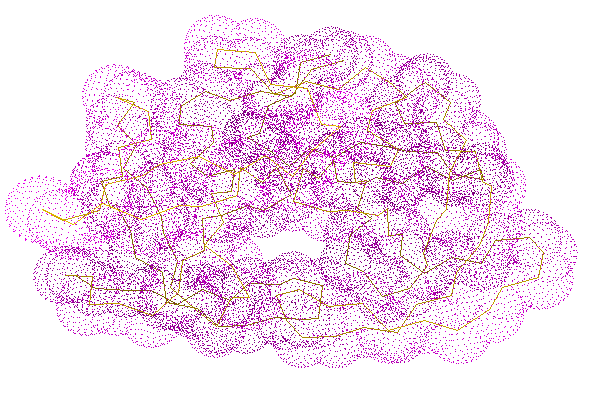 larger image
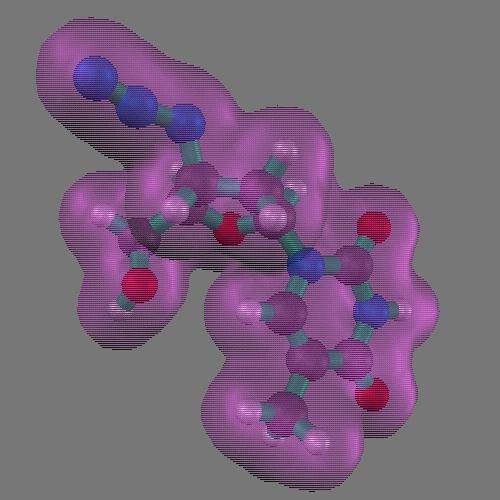 larger image
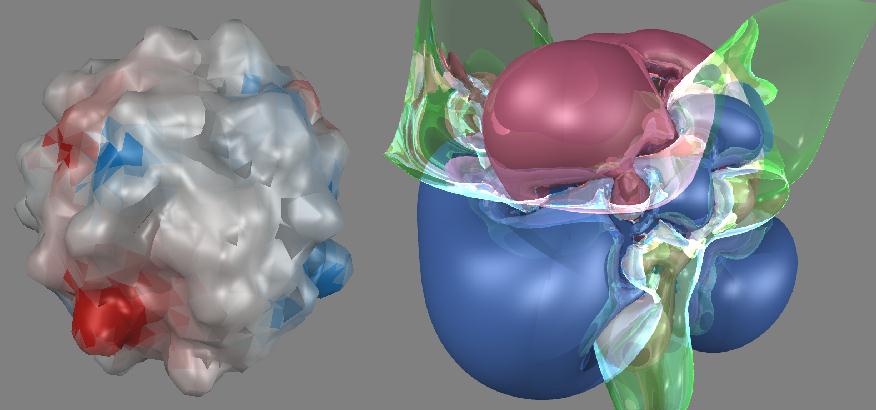 larger image
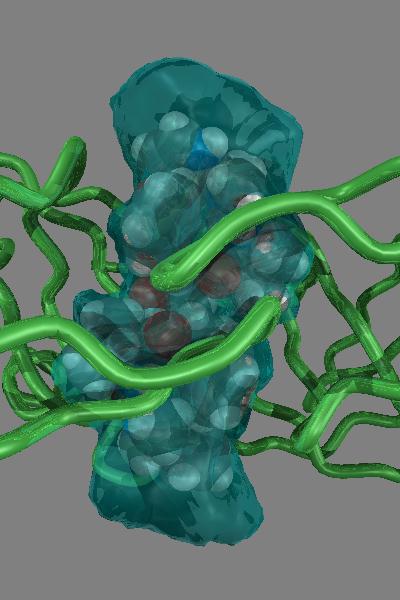 larger image