Data Readers & Extractors
Each of the data layers described below has a separate data reader, in order to select a particular data field ( e.g. "Air Temperature" ) out of the input data file. Associated extractors select a particular day's data out of the month, and this value is easily adjusted from the user interface to quickly visualize alternate days' data.
Map Layer
The bottom layer of the visualization is a simple plane, onto which a map of illinois is applied as a texture map. Six different maps were acquired, as shown in the following thumbnails. Clicking on any of the thumbnails will take you to the web site from which the map was originally obtained. All coordinates for this project were done in terms of degrees of longitude east by degrees of latitude north, and the map plane coordinates were adjusted for each map to align with the rest of the diplayed data. ( Note: negative coordinates in the east direction were used instead of positive coordinates in the west direction, in order to preserve the more intuitive left-to-right arrangement of the state. ) All maps are in JPEG format, and read using a vtkJPEGReader.
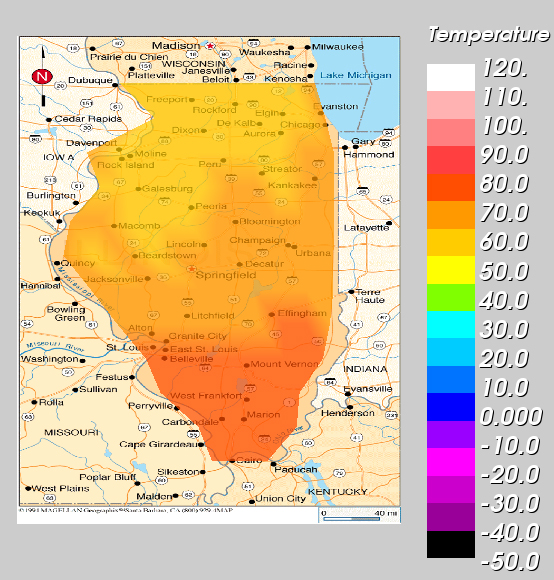
Temperature Display Layer
The temperature display layer is a polygonal planar region in the shape of Illinois ( as determined by the topology of the structured grid format in the data file ), colored according to the input temperature data for either air or soil temperatures. A color map ( lookup table ) was produced to conform to standard temperature encodings for weather temperature data, as seen on the Chicago Tribune weather page web site, http://weather.chicagotribune.com/US/Region/Midwest/2xTemperature.html.
Wind Vectors
vtkHedgeHog was used to generate a series of vectors indicating wind direction and strength at each of the points within the structured grid. The standard simple line was replaced with a cone object, in order to portray direction as well as strength and alignment of the wind directions.
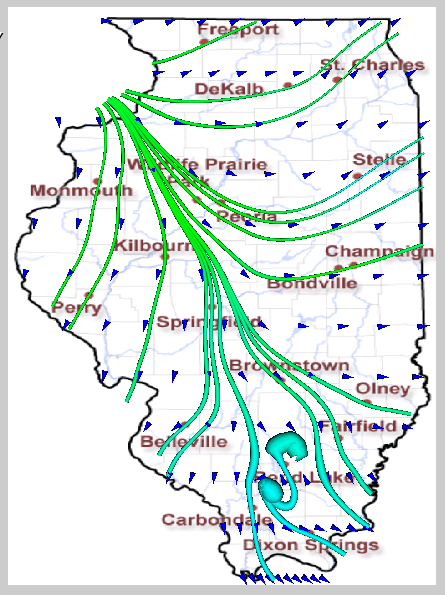
Wind Streamlines
Wind streamlines were generated using a fourth-order Runge-Kutta differentiation of the wind vector data, using the data collection stations as the seed points for the integration process. These streamlines are best observed with the ICN Stations map as the background image.
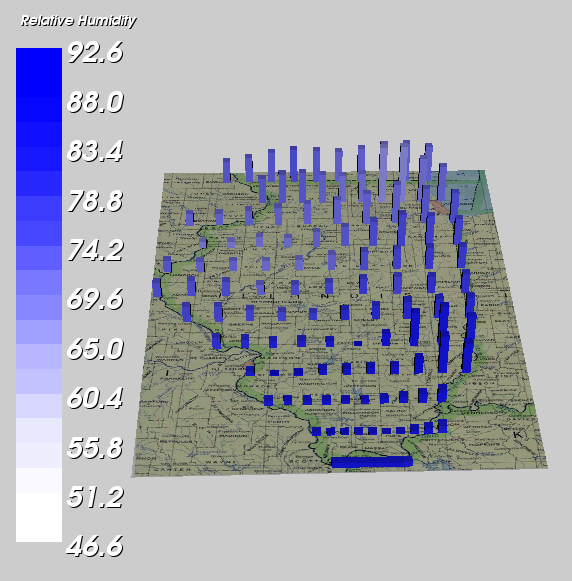
Precipitation & Humidity Icons
The original plan was to create a custom-designed glyph that would show both preciptiation and relative humidity at each point in the structured grid. The format of the glyph was to be a vertical cylinder with a pie wedge colored an alternate color. ( E.g. a 3-D pie chart. ) The height of the cylinder would represent precipitation, and the pie wedge would indicate relative humidity. This glyph was designed around the fact that humidity is bounded to the range of 0 to 100%, and that precipitation can become zero. This design would degrade to a standard 2-D pie chart if there was no rainfall, leaving the humidity information readable, and likewise the precipitation information would be equally discernable regardless of the range of the relative humidity.
These glyps were implemented using vtkProgrammableGlyphs, but the resulting visualization was found to be unsatisfying, and so the glyph design was modified slightly. Rectangular bars were employed instead of round cylinders, and the relative humidity is indicated by color coding instead of by pie wedges. This still allows humidity to be observed when the precipitation is zero and vice-versa, and is cleaner and less cluttered than the original design.
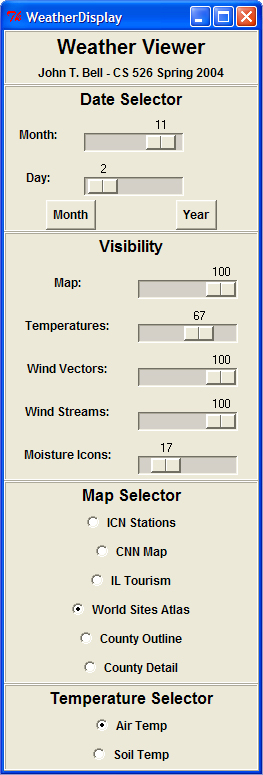
User Interface
The user interface is written in TCL / Tk, and allows the user to adjust all aspects of the visualization. Responsiveness is very good, allowing true interactive browsing of months or years worth of data. The user interface is broken down into four main sections, allowing users to select a particular date, adjust transparency of all objects, select a map to use as a background image, and to select air versus soil temperatures for the temperature maps.
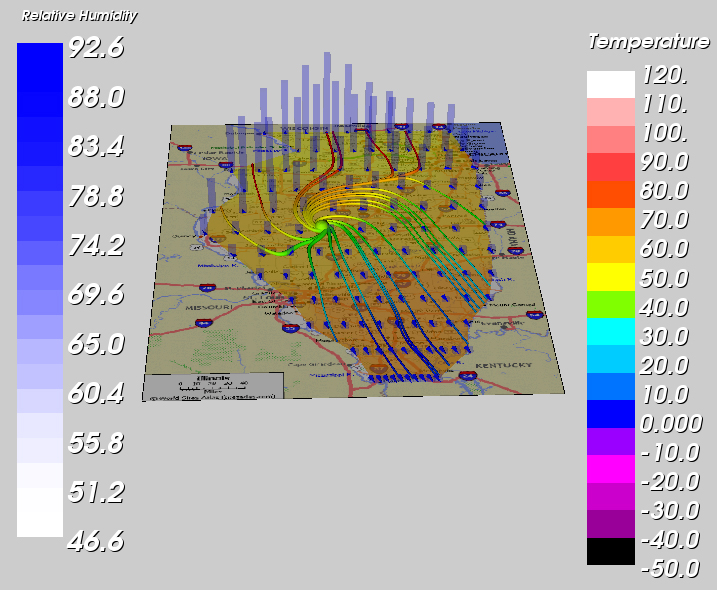
Sample Images: