
Data visualization is the art and science of presenting data in a useful, enjoyable, and meaningful way. Suffrage is a project that exploits data visualization to depict the history of Italy through the evolution of its political parties.
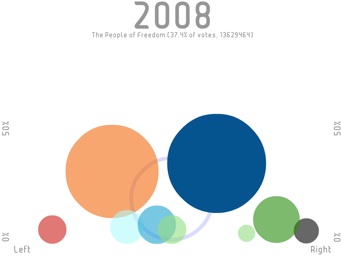
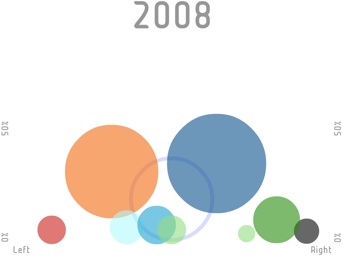
Suffrage shows the results of all the elections from 1921 to 2008 and animates the transitions in order to show growth, raise, and death of parties.
Suffrage has been developed in 36 hours.
Click below to try Suffrage.
Use the arrow on your keyboard to move across the years.