VMBT PROJECTS
Fall 2008 - Present
We are improving the Visual Classifier idea we proposed in the Wikipedia Analysis
project and comparing its performance against "best of breed" classifiers. See work in Publications related to CHIRP and VisClassifier.
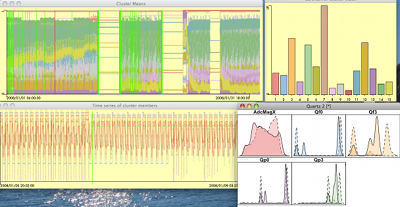
INTERACTIVE GRAPHICS
Summer 2010 - Work done as an intern at AT&T Research
Labs
Worked with Simon Urbanek on
extending iPlots Extreme and particularly on the problem of multivariate time series visualization.
ANGLE
April 2007 - Fall 2008
The goal is to find emergent behaviors in distributed network packet flows. Data is being captured from multiple locations across the country:
- National Center for Data Mining at the University of Illinois at Chicago
- University of Chicago
- Argonne National Laboratory
- Information Sciences Institute at the University of Southern California
Data mining algorithms are developed to build models that would expose local (looking at a subset of locations) and global (looking at the combination of locations) behaviors. Interesting questions about stability of behaviors or clusters of data defined as models are explored with new definitions of emergence or change.
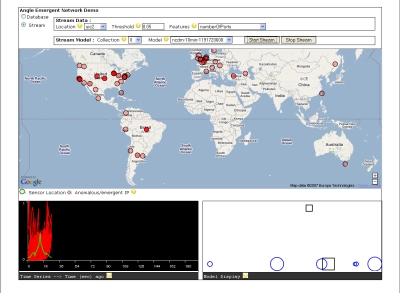
Another aspect of the project is processing large amounts of data in real-time. IP packet data are received from the different locations every ten minutes, features are extracted and similar behaviors are clustered. Data mining algorithms that find emergent behaviors and detect outlying IP addresses or suspicious IP addresses are run on demand through the project website. The latest feature added to the website is real-time streaming and processing of data from any given location.
WIKIPEDIA ANALYSIS
November 2006 - April 2007
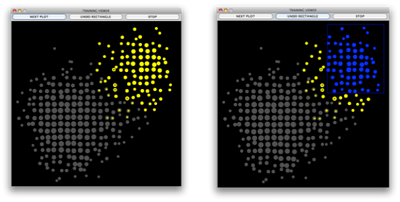
Using the English Wikipedia database dump from December 2006, we aimed to build a visual classifier to classify controversial articles or pages. Wikipedians tag pages as controversial based on a large number of edits over a short time period and this flag is stored in the database. This list of controversial pages is therefore far from being complete.
We developed a list of 7 features from the Discussion page associated with each Article page as that is where editors discuss edits and are free to voice their disagreement. Taking these features we built an application that takes as input a data set with labels for class membership. The user can select Composite Hyper-rectangular Description Regions(CHDRs) (see Publications) that desribe the areas of interest in the data.

The data is colored based on class membership and CHDRs can be traced out to separate certain classes. This is how the visual classifier is built by the data analyst.
Rules are built simultaneously that describe the CHDRs and can be saved. The rules can be applied to a different data set.
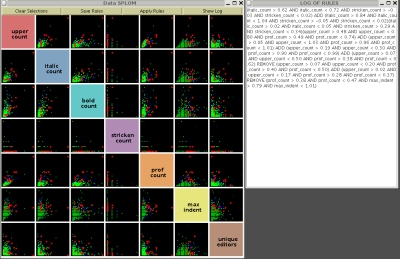
Both when building the visual classifier (set of rules) on a training set, and applying saved rules on a test set, the confusion matrix of correctly classified and misclassified data is computed. This application is now ready to be compared against popular classification methods like SVMs, decisions trees and others. It performed well - approximately 70% accuracy – on the labeled Wikipedia data of controversial pages but needs more validation work to be done by testing it on other data sets.
GRAPH-THEORETIC SCAGNOSITCS
December 2004 - April 2006
Based on John Tukey's idea of scagnostics or scatterplot diagnostics, we developed an Exploratory Data Analysis (EDA) tool that uses graph-theoretic measures to characterize the shape of 2-dimensional point clouds. Therefore, we took a Scatterplot Matrix (SPLOM) of the pairwise combinations of p variables and translated each plot to a point in a k dimensional space where k is the number of distinctive features we chose. In our experiements k = 9 unique measures.
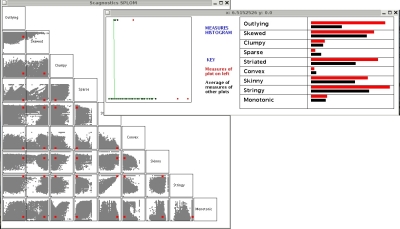
Later work on graph-theoretic scagnostics analyzed the chosen measures to determine homogenity, consistency, sensitivity and dimensionality.
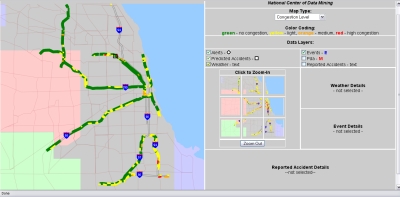
HIGHWAY TRAFFIC
October 2004 - October 2006
Apart from being the first to archive highway sensor data for the Chicagoland area, this project involved the
development of statistical models of the observed behavior of the spatial-temporal data. We analyzed over a year's worth of data (831 sensors
along Chicagoland highways produce readings every 6 minutes) to develop a real-time alerting system to detect anomalous patterns of behavior and
visualize them as well as trends and changes in congestion patterns.