Note: YouTube and Download links are at the bottom
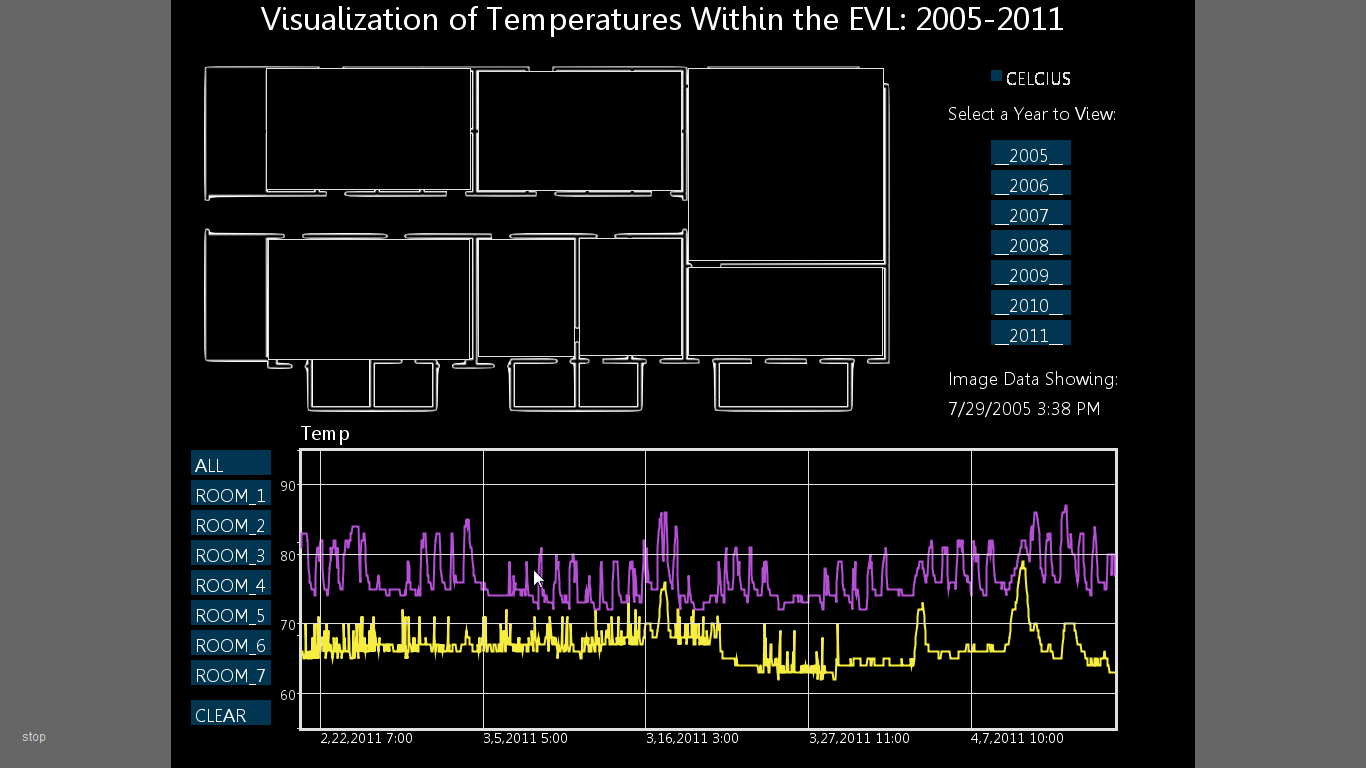
Viewing the data at start up. No modifications made. All plots from 2005 - 2011 shown
Changing the temperature to Celcius. Scaling the graph output accordingly.
Outputting all rooms and dates for the year 2008.
Zooming on the graph and readjusting the graph. The zoom function was written in a way that
would allow for focus on the X variable.
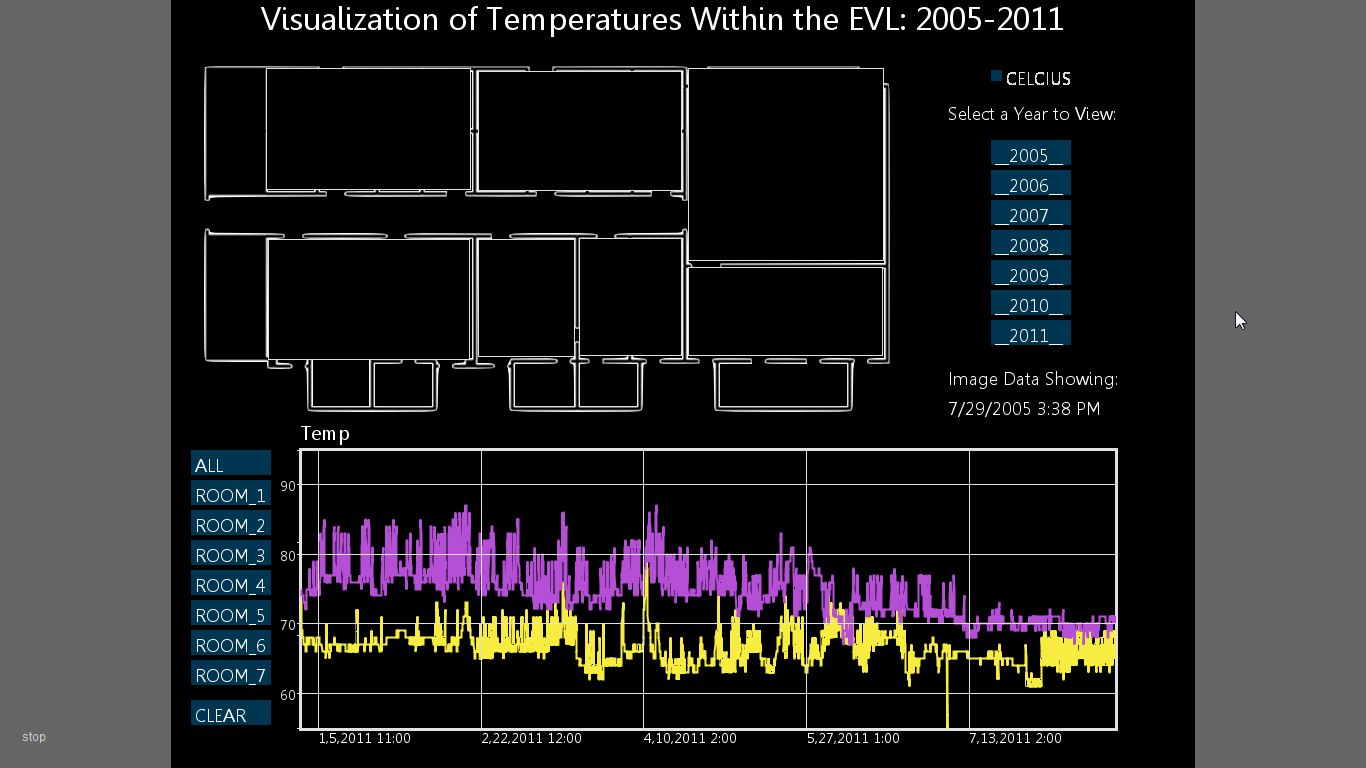
Further focusing in order to show data change, title change and focus on the x axis.
A map is displayed whenever '-' is hit. This gets the entry at a certain point in the graph
and displays it as a temp map. This can be done in any size in either C or F.
Showing the previous in C
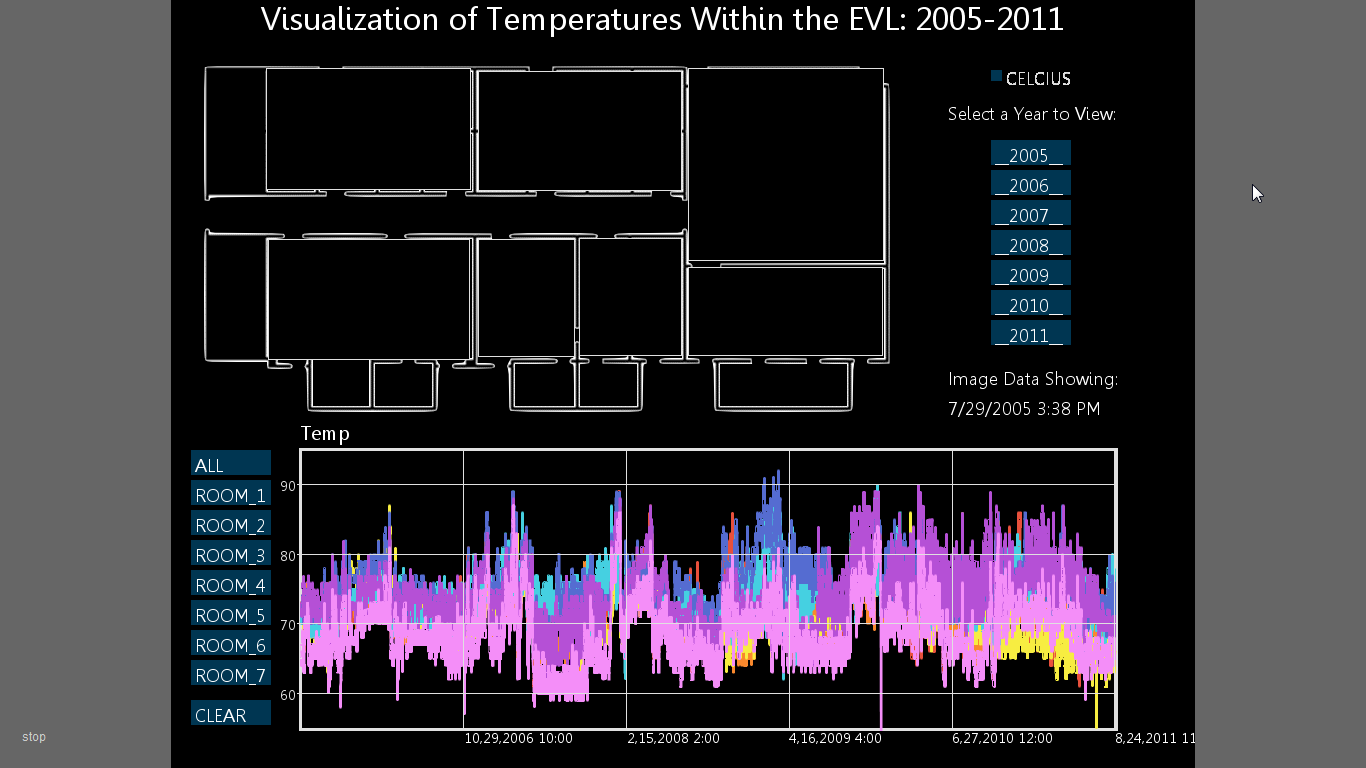 Viewing the data at start up. No modifications made. All plots from 2005 - 2011 shown
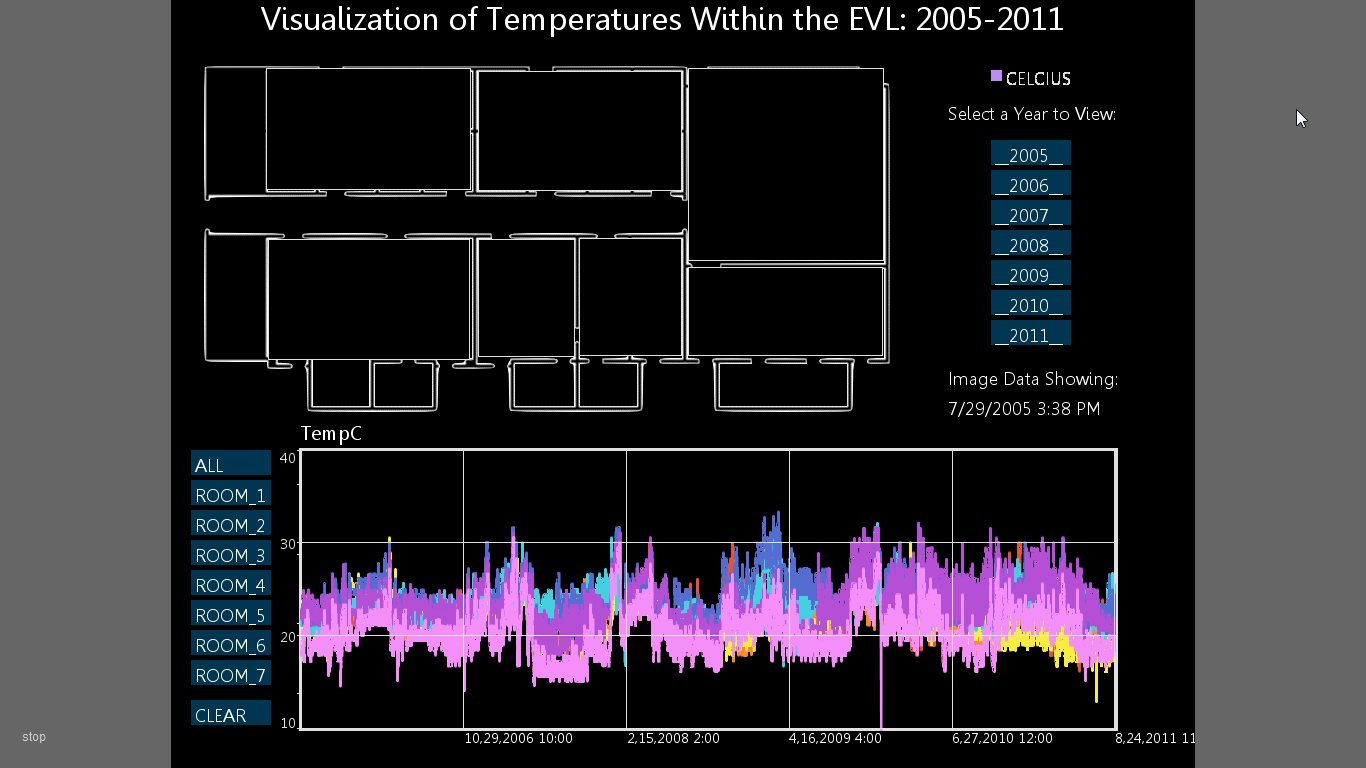 Changing the temperature to Celcius. Scaling the graph output accordingly.
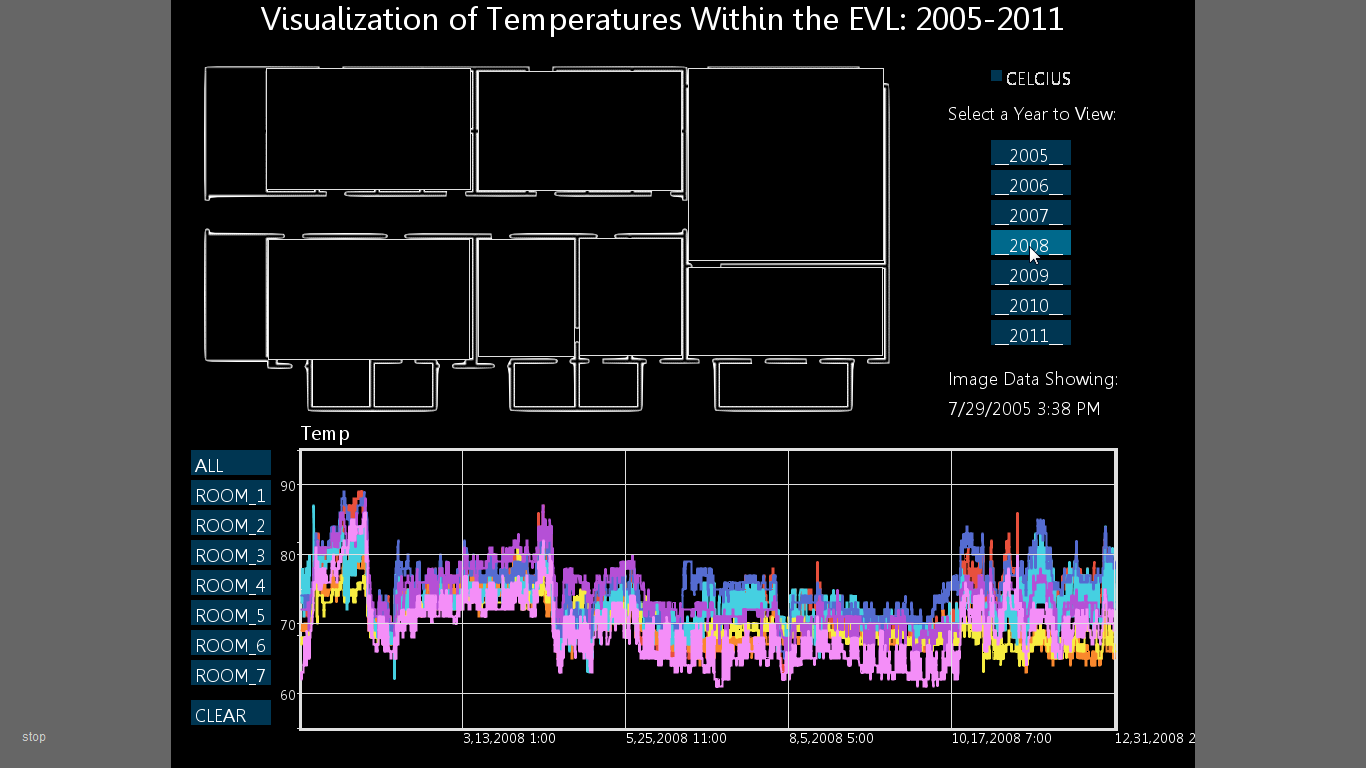 Outputting all rooms and dates for the year 2008.
 Zooming on the graph and readjusting the graph. The zoom function was written in a way that
would allow for focus on the X variable.
Zooming on the graph and readjusting the graph. The zoom function was written in a way that
would allow for focus on the X variable.
 Further focusing in order to show data change, title change and focus on the x axis.
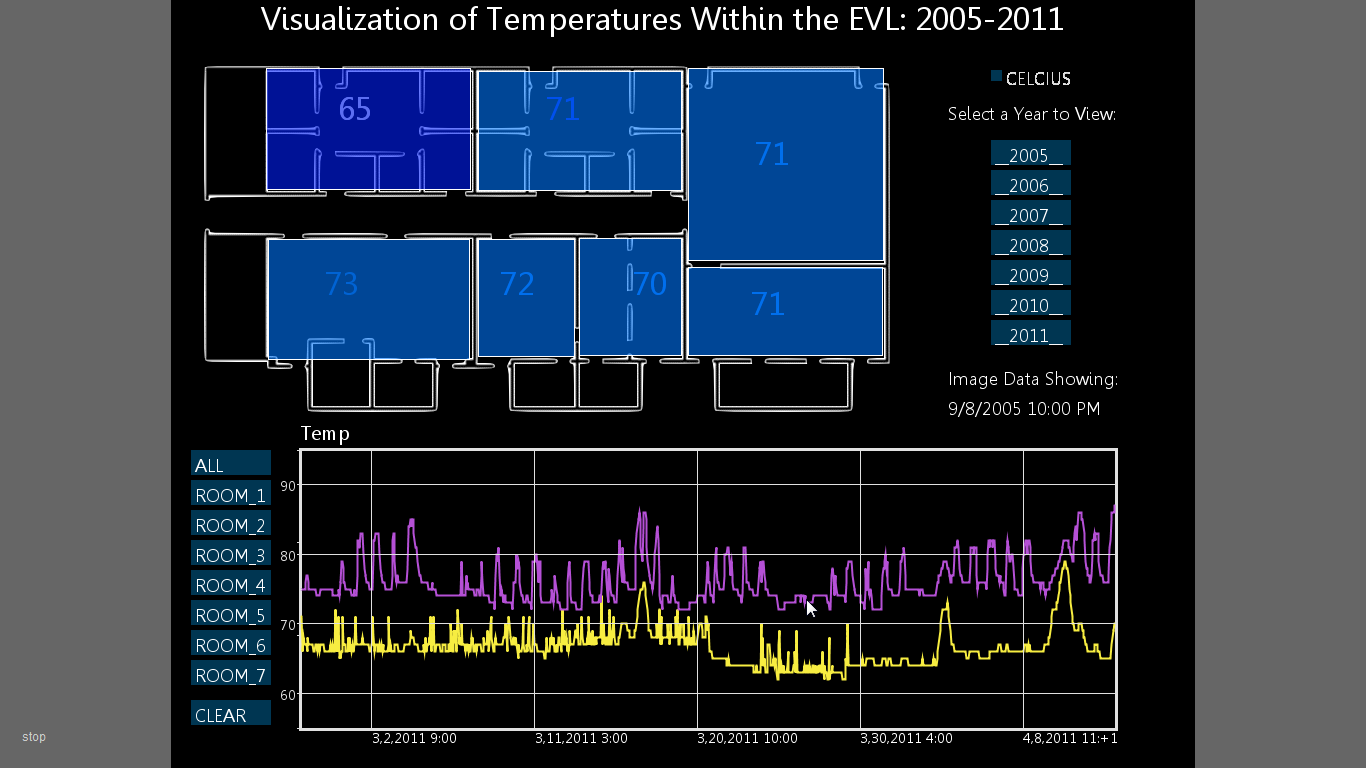 A map is displayed whenever '-' is hit. This gets the entry at a certain point in the graph
and displays it as a temp map. This can be done in any size in either C or F.
A map is displayed whenever '-' is hit. This gets the entry at a certain point in the graph
and displays it as a temp map. This can be done in any size in either C or F.
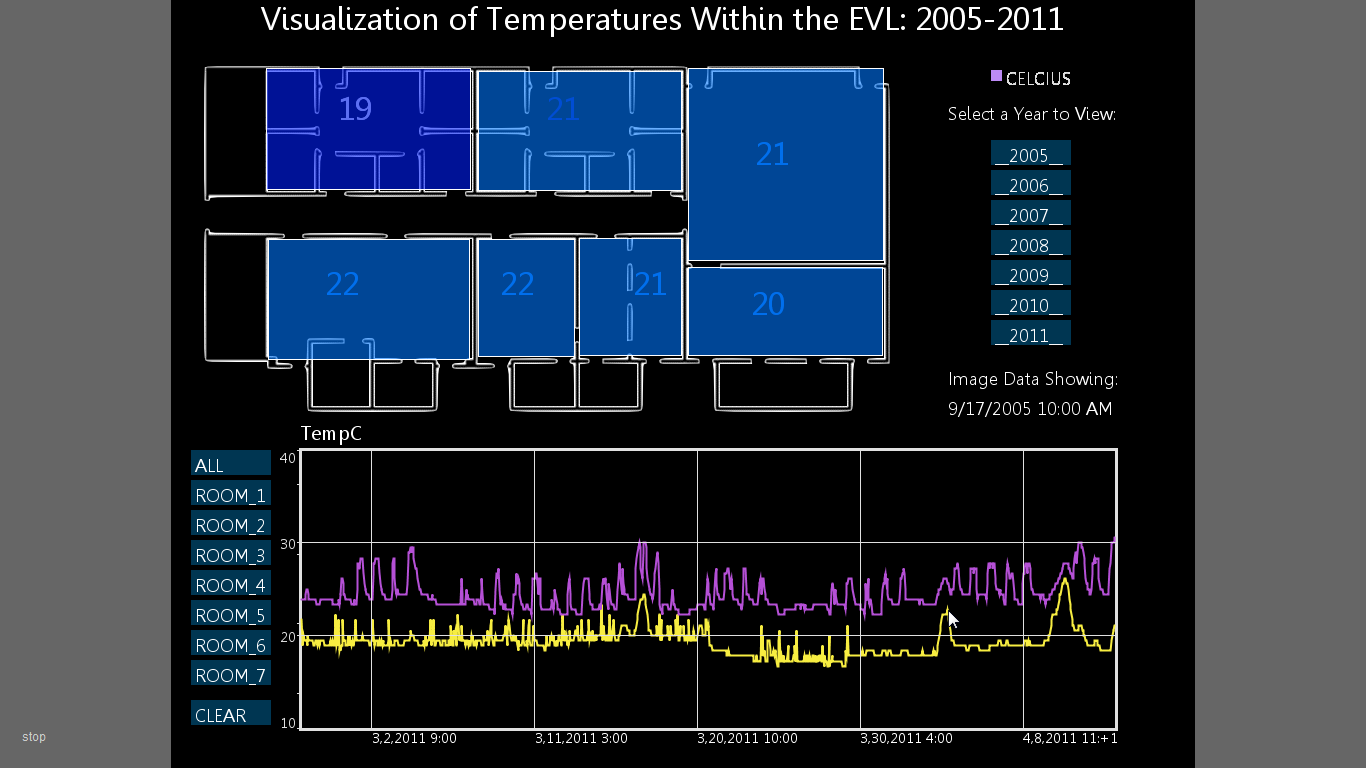 Showing the previous in C