nViZn is a Java foundation for analytical graphics. It began as a package of Java classes called GPL (Graphics Production Library) that Dan Rope developed while working at the Bureau of Labor Statistics and studying in the graduate statistics program at George Mason University. Dan developed the system in 1996 with his advisor Dan Carr. About that time, I gave a talk on graphics algebra at the 1996 SISC/Interface in Sydney, Australia. Dan Carr came up at the end to tell me about Dan Rope and to ask whether I would be interested in pooling talents. The three of us got together under the support of SPSS and began development of a completely new system based on the algebra presented in my talk, Dan Rope's interactive graphics controllers, and Dan Carr's chart template designs.
Dan Rope and I designed the basic system. Dan Rope coded its core, I coded the statistics and geometry components, and Matt Rubin coded the displayer/renderer. Soon after, Andy Norton joined the team and developed an interactive Java testbed for the system and enhanced the distributed architecture to handle multiple firewalls and other complex computing environments.
nViZn is best understood as a geometric analytical engine. The following diagram illustrates its data-flow architecture. Although this diagram does not show how its components are distributed or how users interact with a display, it does reveal the multiple stages that allow nViZn to create the rich variety of displays shown in The Grammar of Graphics. The rounded boxes in the display represent input/output objects and the square boxes are functional objects. Functional objects connect by loops (circuits) are transformations.
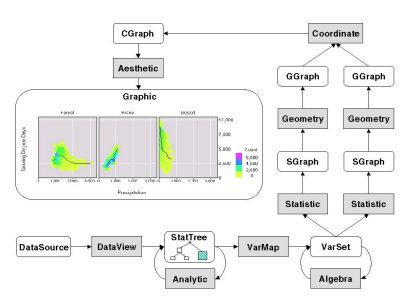
Data are received by DataView through an abstract interface that can be tailored to different types of data sources. These are processed into a StatTree, which is a tree of tables of data.
A set of Analytics (Regression, Principal Components, Cluster Analysis, Sequence Analysis, Graph Layouts, Correspondence Analysis, Sampling, Missing Value Imputation, Aggregation, ...) can recursively process StatTrees and then hand them over to the VarMap object, which extracts results and structures them as collections of derived variables. Putting high-level analytics inside a graphical system enables real-time updates to a graphic display. Unlike traditional data-mining systems, nViZn revises its model whenever the data change.
Algebra operates on sets of variables to produce more complex displays of repeated measurements or nested sub-classes. It is similar in some respects to a relational database algebra.
One or more Statistic objects take the composite variables output by Algebra and create summaries, confidence regions, smoothers, densities, and other statistical estimates. The graphic in the figure shows a black smoother and a colored density within each panel, so I have shown two Statistic paths in the figure.
Statistic creates a Statistical Graph (SGraph) that comprises a statistical summary. Geometry operates on this SGraph to produce various geometric objects such as points, lines, intervals, and tiles. These objects are called Geometric graphs (Ggraph).
GGraphs can be embedded in various coordinate systems. For example, we can tile a plane, a disk, a sphere, and so on. We can embed a regression line in rectangular, polar, or other coordinates. The Coordinate object does this and produces a CGraph.
The graphs we have been talking about cannot be seen, heard, tasted, or otherwise perceived. It is the job of the Aesthetic object to act as a function on the elements of a CGraph and translate them into real numbers or characters that control some display device, such as a CRT, plotter, sound generator, or even odor generator. Once we have done this, we have what I call a graphic. A graphic is a perceivable graph.
nViZn includes numerous controllers that attach various widgets (sliders, buttons, magnifiers, etc.) to any aspect of a graphic. It is these controllers that give nViZn the capability for drill-down, brushing, zooming, and other exploration. All of these are designed to work in a browser on the Internet or on the desktop.
Figures:
Links: