The application shows temperatures from August 2005 to July 2001 of EVL at UIC. There is a block diagram depicting the relative positions of the rooms of which the temperatures are available. Clicking on a room selects that and its temperature is shown in the same color in the graph.
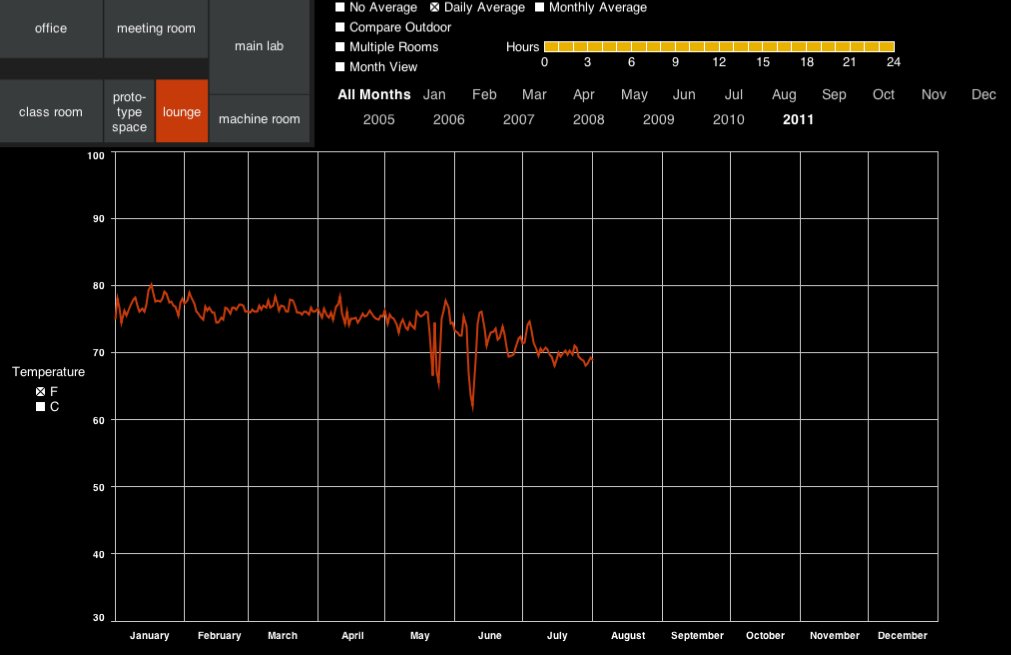
Image: Room color is used to show its temperature.
Temperature is shown in Fahrenheit by default, it can be changed to Celsius. If we want to see data during the particular time of the day, that can be selected using the "Hour" slider. Also outdoor temperature can be viewed by checking the "Compare Outdoor" box.
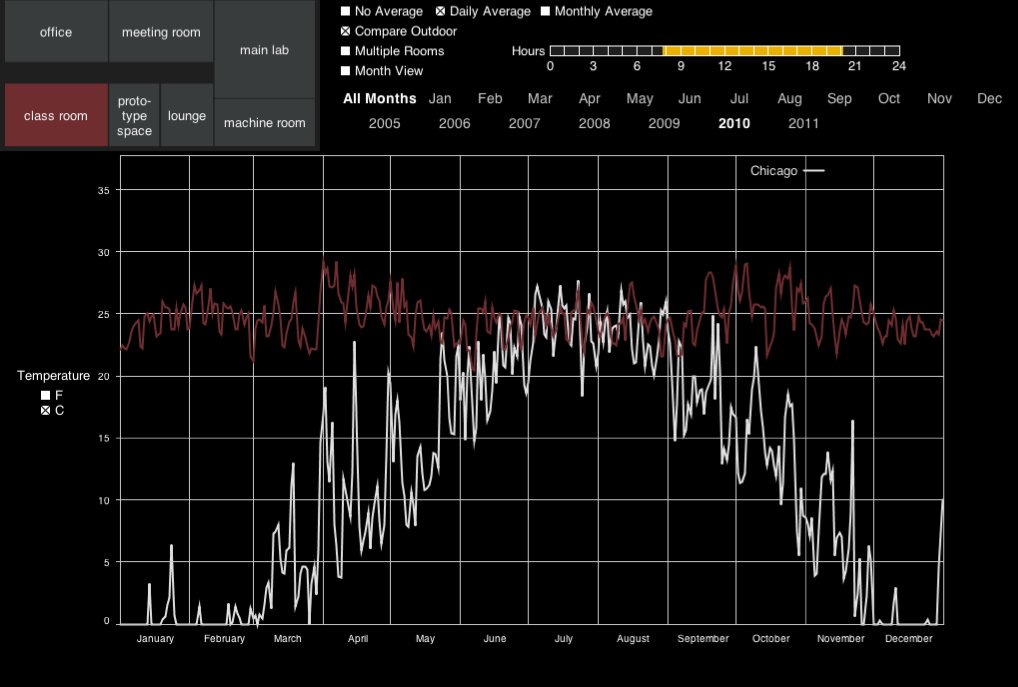
Image: Outdoor temperature is shown in white. Time slider is set from 8 am to 8 pm. And temperature is shown in degree Celsius.
Graph has three views: Month View, Year View (the default) and all the data altogether.
In year view, month endings are marked. Data can be observed as monthly average or daily average or without averaging.
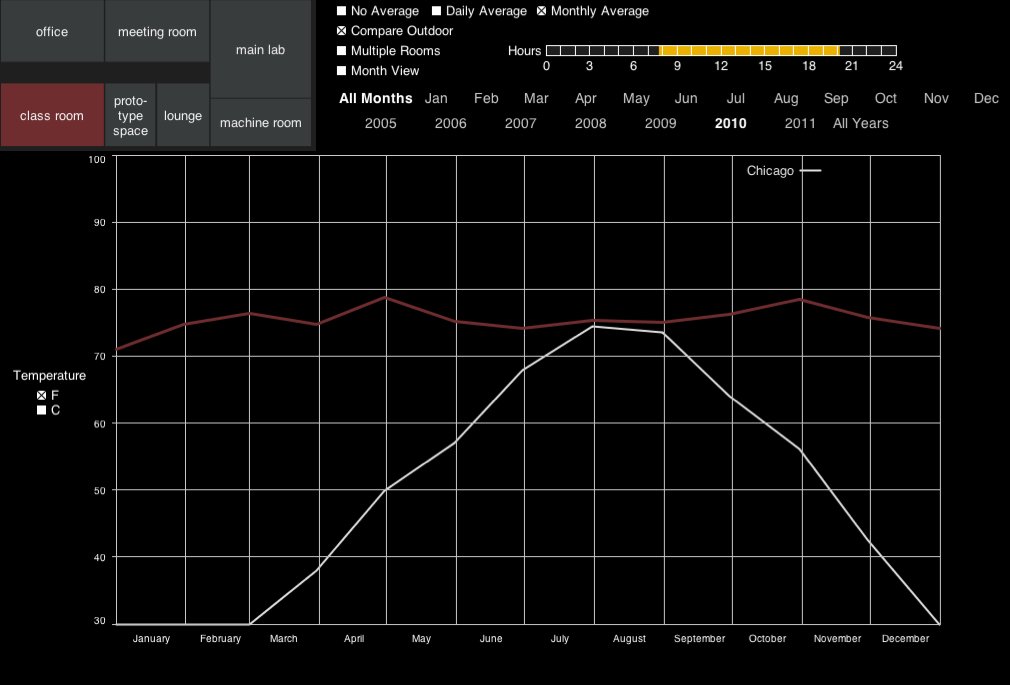
Image: Average temperatures of months in year 2010 during the time 8am to 8pm in class room.
Month View cannot be selected while "Monthly Average" is checked. Switching to "Daily Average" or "No average" enables "Month View". Multiple years can be compared (if not in "Multiple Rooms" mode) for the same month along with the outdoor temperature of the latest month.
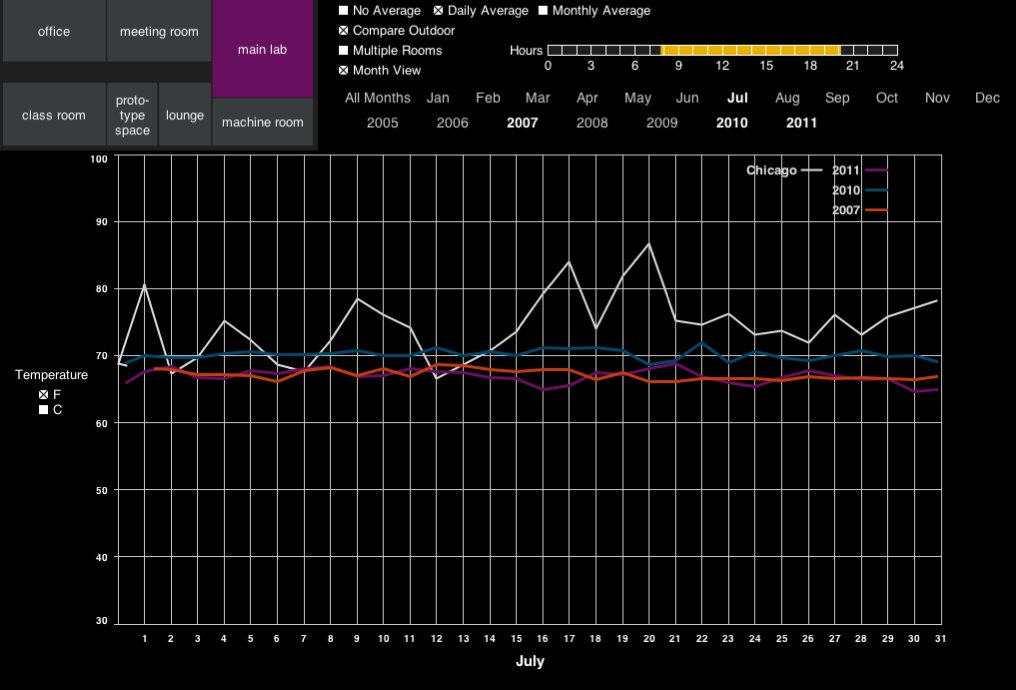
Image: Daily average temperatures during the time 8am to 8pm of main lab in July of 2007, 2010 and 2011 along with outdoor temperature of the duration in 2011.
Multiple rooms can be compared by checking the "Multiple Rooms" box.
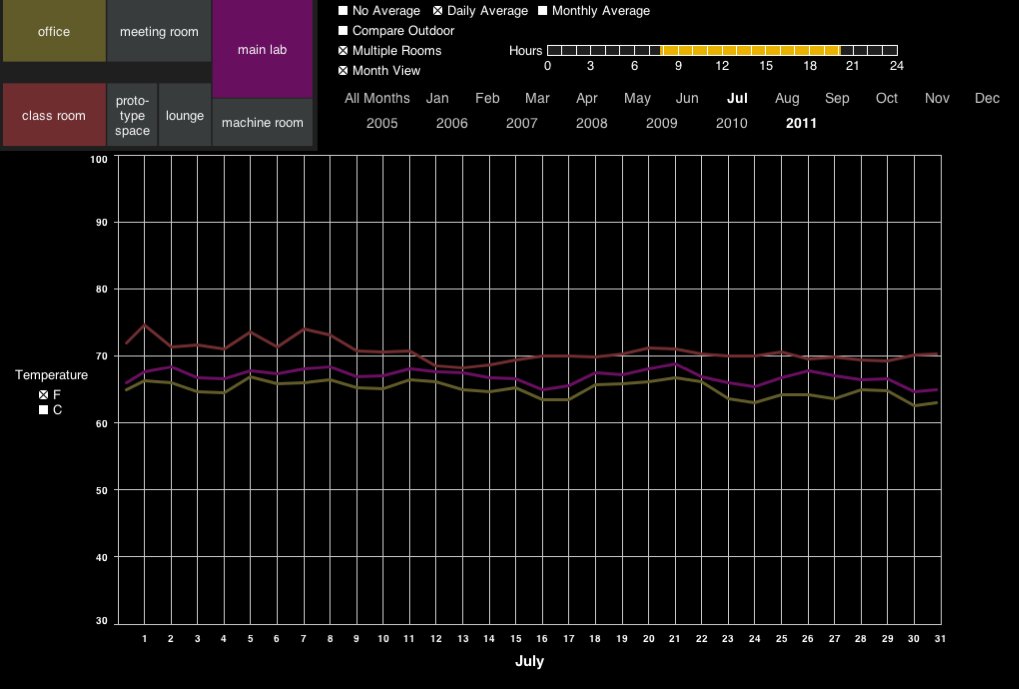
Image: Displaying office, class room and main lab temperatures of July 2011, daily average.
Also, when in "Monthly Average" mode, "All Years" option is visible. All the data are then shown averaged monthly (bounded by the time slider).
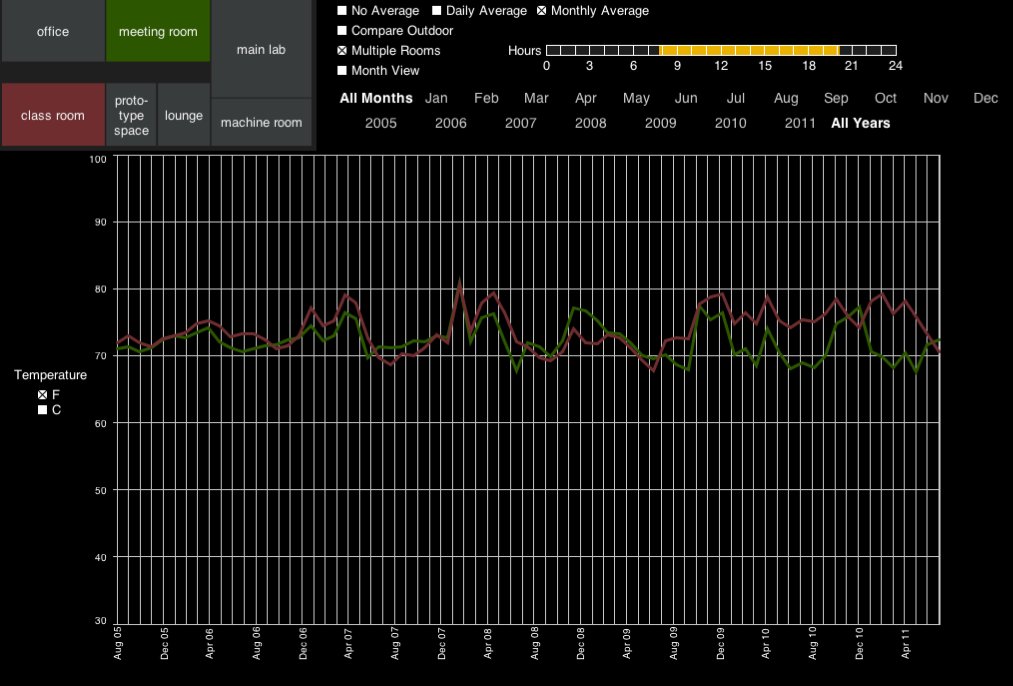
Image: Averaging monthly all the data for class room and meeting room.
Here is a video demo of the application: